This project started after I read Kumar, Dao and May's speculative speculative decoding (SSD) paper which takes ordinary speculative decoding and moves the drafter onto a second GPU. While the big model is checking one draft, the small one is already preparing the next. If that works, drafting becomes almost free. I wanted to see it work with my own hands, so I built it.
My first version made things worse. SSD took 12.5 seconds to generate 128 tokens, slower than plain speculative decoding (4.0 s) and slower than ordinary one-token-at-a-time decoding (5.9 s), the thing both were supposed to beat.
The same pipeline now generates 697 tokens/sec for a single request on two B300s, using a Qwen2.5-7B target with FP8 weights and a trained EAGLE-3 drafter. That's about 2× my own tuned autoregressive baseline on the same hardware, and still 30% short of the 1,000 tokens/sec I was aiming for.
This is the worklog of how I got there, in the order things happened: what I measured, what I thought was wrong, what was actually wrong, and what that pointed me to next.
Starting point: a deliberately simple baseline
Before any optimization, I wrote the simplest version of all three decoders I could, in one notebook, plus a benchmark that timed each one generating 128 tokens:
- AR (autoregressive): Qwen2.5-7B-Instruct, one forward pass per token.
- SD (speculative decoding): Qwen2.5-0.5B drafts a few tokens, the 7B checks them all in one pass, and the matching prefix is kept.
- SSD: the same, with the drafter on a second GPU preparing the next draft while the 7B checks the current one.
These were written in plain PyTorch, since the goal was a working end-to-end version and a number to beat. (I didn't record which GPU it ran on, so treat these timings as a rough starting point, not a controlled baseline.)
| Decoder | Time for 128 tokens |
|---|---|
| AR | 5.88 s |
| SD | 3.97 s |
| SSD | 12.54 s |
SD helped a little. SSD, the method I actually cared about, was 2× slower than doing nothing clever. Then I noticed the three decoders weren't even producing the same text (AR's answer said "the processor can start executing instructions", SD and SSD said "the CPU can"), which meant they weren't doing the same work, which meant the comparison didn't mean anything yet.
That was the starting point. Everything after this is that baseline getting measured more carefully, built on top of, broken down, and rebuilt.
The physics: what limits one request
At batch size 1, generating a token means streaming every weight through the GPU once while doing almost no arithmetic per byte. Decode is bound by memory bandwidth, not FLOPs.
Qwen2.5-7B with FP8 projections and a BF16 output head is about 7.6 GB of weights read per step. A B300's published peak is 8 TB/s. So:
That number bounds the whole project. My goal of 1,000 tokens/sec is basically the speed of light (SOL) for autoregressive decoding.
Why not just get AR to that line, then?
Because 1,050 assumes 100% of peak bandwidth, zero time on anything except weights, and zero gaps between kernels. Even a pure streaming copy, the simplest possible memory workload, topped out at 7.07–7.35 TB/s (88–92% of peak) when I measured it on a B300, and real decode kernels do worse than a copy. On top of the weights, every step also reads the KV cache, writes activations, launches dozens of kernels, and synchronizes. A very good AR implementation lands well below 1,000. To hit 1,000 you have to get more than one token out of each pass over the weights.
Speculative decoding (SD)
A cheap drafter proposes K tokens. The target checks all K in one forward pass. Because that pass is bandwidth-bound, checking K+1 positions costs about the same as checking one. Keep the longest correct prefix, fix the first wrong token, repeat. With greedy decoding, the output is identical to what the target would generate alone.
If each drafted token is accepted independently with probability α, the expected tokens per round (Leviathan et al.) and the resulting throughput are:
where is one draft step, is one verification pass (≈ one AR step), and is everything else: sampling, cache rollback, synchronization. Deeper drafts raise τ but also raise , so there's an optimal K for every workload. In practice acceptance isn't independent per token, so I measure τ directly instead of trusting the formula.
Speculative speculative decoding (SSD)
SSD attacks the term. While the target verifies on GPU 0, the drafter on GPU 1 guesses how verification will end and pre-drafts the next round for the likely outcomes. If one of those guesses hits (probability p), the next draft is already done. If not, it drafts from scratch:
The best case is that SSD hides drafting entirely, so its ceiling over SD is . That ratio is the most useful number in this post. SSD can only win back the draft time, and it pays and the cost of wrong branches to try. If drafting is a small slice of a round, SSD can't help much, however clever it is.
AR:   target → target → target → target

SD:   draft K → target verifies → accept prefix + fix → draft K → ...

SSD:  GPU 0: verify block → commit → verify block → ...
      GPU 1: predict outcomes → pre-draft branches → hand over the one that hit
Making the comparison fair
The first job was turning the notebook into something I could test and that too efficiently. I kept the original untouched as a reference point and rebuilt the three decoders in a separate codebase.
The first biggest change was the KV cache. The notebook was using Hugging Face's DynamicCache, which grows by concatenating each new token onto the stored tensors, so the cache keeps getting reallocated and copied as it grows. Rejecting draft tokens was building a brand new cache, layer by layer, from slices of the old one. Further, SSD duplicated the whole cache once per branch. All of that copying, was extremely expensive.
The cache rewrite gave each sequence one fixed buffer plus a cursor saying how much of it is valid. What that means for each decoder:
- AR only ever appends, so it just writes the next slot and moves the cursor forward.
- SD (on one GPU or two) writes the draft's entries speculatively. If the 7B rejects some of them, the cursor moves back and those slots get overwritten next round. Nothing is copied or freed.
- SSD branches no longer copy the whole history. They point at the shared part that's already been accepted and only store their own new tokens.
With a new and better cache, the next step was understanding "Why were the decoders producing different text?"
Why the decoders disagreed? 🤔
Both models ran in BF16 on every path, so greedy SD should have reproduced AR token for token, and it still didn't. I traced one mismatch down to a single position. Running one token at a time, the target's top 2 logits were 30.0 and 29.875. Running the same position inside a verification block(in SD), the same model gave 29.875 and 29.875. A tie. After this, Greedy decoding picked a different token, and from that point on, the two decoders were writing different text.
Why did this happen though?
A logit is a long sum of products, and floating point addition isn't associative i.e the order you add numbers in changes the last few bits of the answer. A matmul over one row and a matmul over five rows get dispatched to different kernels, and those kernels split and add the sum in different orders (PyTorch's notes on this). So even making sure that "BF16 everywhere" was attacking the number format, not the arithmetic. Our Speculation decoder kept running into these types of arithmetic differences all the time, because AR always computes one position per pass and verification always computes several.
That was the core problem: AR and verification push the same model through differently shaped computations, so their results differ in the last bits, and any near-tie can flip a token. Further, more precision for the activations and the weights, didn't fix the problem, it only made ties rarer. An FP32 output head fixed that particular tie, but a 32B model with an FP32 head still diverged at token six.
So I set a rule for the rest of the project: under greedy decoding, AR, SD and SSD must produce byte-identical output, or a speedup doesn't count. Greedy speculative decoding is supposed to be lossless. The drafter only changes how fast tokens come out, never which tokens. That gives me a free correctness test: if SD's text ever differs from AR's, something is wrong, whether it's a rounding difference or a real bug in rejection or cache rollback. And if the text differs, I'm not even timing the same work anymore. One decoder might be writing a shorter answer or stopping earlier, and the "speedup" would just be that.
In practice the rule turned into an agreement suite i.e a set of automated checks I reran after every change, before trusting any timing. It checks instances where speculation can quietly go wrong:
- Every rejection pattern. The 7B can accept 0, 1, 2, ... or all K drafted tokens. Each case has to roll the cache back to exactly the right spot.
- Stale entries. Cache slots past the cursor must be masked out, never read.
- Stopping. An end-of-sequence token must stop every decoder at the same place, even mid-draft.
- Reuse. Running a new, unrelated request on the same buffers must not leak anything from the last one.
- Later additions. The suite grew every time I found a new kind of bug. When numbers like "117 checks" or "161 checks" show up later, that's this suite as it stood at that point.
To get a first comparison that passed the rule, I ran everything in FP32 on two rented H100s, where the arithmetic differences were too small to flip any tokens.
A fair comparison, and SSD still lost
The evaluation set was six prompts, each generating 128 tokens: a code, a math and a prose prompt, each in a short version and a version with extra context (a buggy class to review, a word problem, a long scenario). Settings like draft length were tuned on three separate prompts, so the evaluation prompts never influenced them. Each prompt ran three times. That gives 18 paired cases: the same prompt and repeat, timed under every decoder.
| Method | Tokens/sec |
|---|---|
| Custom AR | 71.61 |
| Hugging Face reference | 55.32 |
| SD, 1 GPU | 47.19 |
| SD, 2 GPUs | 46.08 |
| SSD, 2 GPUs | 34.80 |
Outputs matched exactly, but SSD was still way slower than AR in all 18 cases. My first hunch was that the drafter was guessing badly. To check, I broke each decode into rounds. A Round is one forward pass of the 7B. For AR, a round produces one token. For SD and SSD, it checks a draft and keeps the accepted tokens plus one correction. The decoders count every round and every drafted and accepted token, which gives:
- tokens per round = tokens generated ÷ rounds
- time per round = decode time ÷ rounds
- acceptance = drafted tokens the 7B accepted ÷ drafted tokens proposed
- branch hit rate (SSD only) = how often the branch SSD prepared in advance turned out to be the one it needed
| Method | Tokens per round | Time per round | Time per token |
|---|---|---|---|
| AR | 1.00 | 13.6 ms | 13.6 ms |
| SD (K=4) | 3.19 | 67.9 ms | 21.3 ms |
| SSD (K=2) | 2.36 | 66.7 ms | 28.3 ms |
The drafter was fine. SD accepted 55.6% of drafted tokens at K=4, SSD accepted 68.4% at K=2, and SSD's prepared branch was the right one 64.5% of the time. SD was getting over three tokens per round, against AR's one.
The problem was the cost of a round. An AR round is one 7B pass: 13.6 ms. An SD round is one 7B pass plus four draft steps from a model 14× smaller, so it should cost a little over 13.6 ms. It cost 67.9 ms, five times an AR round (67.9 ÷ 13.6 ≈ 5). Each of the four draft steps cost about as much as a full 7B pass.
That only adds up if a 0.5B step costs as much as a 7B step, and in eager PyTorch it did. A profile of one 128-token SSD decode recorded 325,497 kernel launches, about 2,500 per generated token. Each launch has a fixed CPU cost, so both models were launch-bound, because of which model size barely mattered. With no cheap draft to hide, SSD had nothing to gain. In that same profile, the two GPUs had a work overlap of only 2.6 ms out of a 5.7 second decode.
My first fix made things worse. SSD only helps if the drafter's work overlaps the 7B's work, so I changed the Python code to kick off the drafter's next round earlier, before the current verification finished. The GPUs did overlap more, but every extra bit of coordination was more Python on the critical path, and SSD dropped from 35.7 to 30.9 tokens/sec. Moving launches around wasn't going to work. I had to stop launching from Python at all.
Getting Python out of the way
The standard fix for launch overhead is CUDA graphs. You record a whole forward pass once, then replay it with a single launch, so the CPU stops dispatching kernels one at a time.
The catch is that a graph replays exactly what it recorded, memory addresses included. Anything that moves between replays breaks it. That forced a second round of cache work:
- Every KV buffer is allocated once, at full capacity, and never reallocated, so its address never changes.
- Positions and cache lengths are passed in as GPU tensors instead of Python integers, so one graph works at every step.
- All layers' KV caches are packed into a single contiguous allocation.
I graphed AR as well. Then I ran the same code with and without graphs on one H100, changing nothing else:
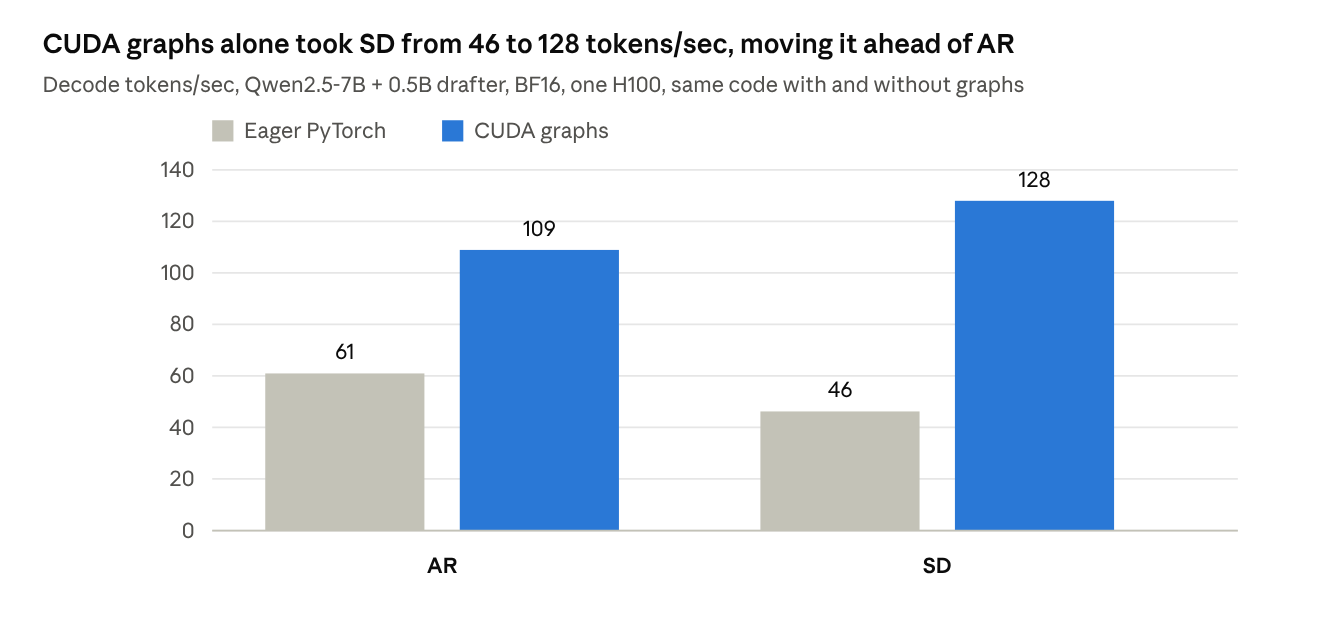
AR went from 61 to 109 tokens/sec and SD from 46 to 128. SD flipped from losing to winning without the algorithm changing at all. Only the cost of launching it changed.
Note: Graphs need fixed shapes, so this version padded every verification to a fixed 8 positions (K drafted tokens plus one, rounded up to 8 rows), and that changed the output in 12 of 18 requests compared with plain AR. It's a clean measurement of launch overhead, not yet an exact output speedup.
This test only covers AR and SD because it ran on one GPU. SSD needs two, and graphing each model's forward pass wasn't enough on its own, because SSD's overhead lived between the passes. Two changes fixed that:
-
I recorded a whole draft proposal, all K draft steps of a round, as one graph, so drafting became one launch instead of K.
-
I removed the Python helper thread that used to start the drafter's speculative work. Now that work is queued on the drafter's GPU right after the 7B's verification graph is launched, with no Python in between.
With those two changes, SSD on the 7B reached 1.44× faster than AR and 1.24× faster than SD, with the same padding caveat.
The bug every decoder agreed on
At this point AR, SD and SSD all produced the same text. Before calling the H100 results done, I ran one more check I'd planned from the start, because I knew agreement had a blind spot: all three decoders use the same attention kernel. If that kernel is wrong, all three will be wrong in exactly the same way. Agreement would only prove that the decoders are consistent, not that the model is right.
The check was simple, run 1 forward pass through my model and through Hugging Face's reference implementation, then compare the logits directly. The Hugging Face version is slow, but it's known to be right, so it's an outside opinion. On the attention path that runs before anything is cached, the gap came back bigger than the logits themselves (relative error above 1).
The cause was one line. To load a value from V, the kernel works out where it sits in memory from 3 indices (which head, which token, which dimension), each multiplied by a stride: how many elements to jump to move one step along that index. The buggy line used K's strides (KH, KT, KD) to find values in V. The fix uses V's own strides (VH, VT, VD):
-  v = tl.load(V + kh*KH + key[:,None]*KT + dim[None,:]*KD, key[:,None] < C, 0)
+  v = tl.load(V + kh*VH + key[:,None]*VT + dim[None,:]*VD, key[:,None] < C, 0)
The fix gives the kernel V's own strides (v.stride(1), v.stride(2), v.stride(3)) as separate arguments, instead of reusing K's. Strides tell the kernel how far apart consecutive rows and columns sit in memory. Inside the KV cache, K and V are stored exactly the same way, so K's strides happened to be right for V too, and the bug never showed up. Outside the cache, they're different. RoPE rotates K and writes the result into a brand-new tensor, while V is still a slice of the big packed QKV output, with its rows spaced further apart. Same shape, different layout, and my kernel only ever looked at K's.
Since all 3 decoders called that same kernel, they were all wrong together and in perfect agreement. After this I kept 3 separate checks:
- Do AR, SD and SSD produce the same tokens?
- Does my backend compute the same logits as a reference implementation?
- Is the model still good at its job?
The first SSD win
The same round of work also added fused kernels for RMSNorm and SwiGLU, packed QKV and gate/up projections, and cache handoffs between the two GPUs moved onto their own CUDA streams so copies could overlap with compute. That combination, on top of graphs and the draft capture above, produced the first result where SSD clearly won with exact outputs:
| Target, backend | AR, 1 GPU | SD, 1 GPU | SSD, 2 GPUs | SSD vs best SD |
|---|---|---|---|---|
| 7B, fused BF16 | 126 | 157 | 229 | 1.46× |
| 7B, invariant BF16 | 109 | 158 | 220 | 1.41× |
| 32B, fused BF16 | 35 | 89 | 102 | 1.08× |
These are tokens/sec for whole requests, prefill included, over 8 new prompts run 3 times each. The two backends differ in how they add things up. "Fused" lets each kernel pick its fastest strategy for each shape. "Invariant" forces every kernel to split and add its sums the same way whether it's processing 1 row (AR) or 5 (verification), which attacks the tie-flipping problem from the start of this post directly, at some cost in speed. The last column is the median speedup per request. For every prompt and run, I divided the best SD's time by SSD's time, which gives one speedup per request, and then took the median of those. That shows how much faster a typical request got, and one unusually long or short request can't skew it the way it can skew a ratio of averages.
On the 7B, SSD beat the best SD by 1.41–1.46×. On the 32B, only 1.08×. A bigger target makes verification the dominant cost, so drafting is a smaller share of each round and there's less for SSD to hide. A longer verification does give the drafter more idle time to prepare extra branches, which raises the hit rate, but a hit can still only save the draft time, so the ceiling still shrinks:
As the verification time grows, the term shrinks toward zero, however many branches you prepare. These gains came from all the changes in this section together. (I was in the flow and didn't measure each one's share separately.)
"We're nowhere near SOL"
229 tokens/sec looked fine until I put it next to the roofline. The next step was writing custom kernels. Around then I had free credits for B300s and wanted to save some money, so I moved the work over to B300s for a while.
The H100 kernels carried over, and the B300 work pushed further: the residual add and RMSNorm folded into the end of the matmul kernels, RoPE and the KV-cache write now happen inside the QKV projection instead of as separate kernels, a vocab head that computes only the winning token instead of writing out all ~152k logits, accept/reject decisions made on the GPU so the CPU never has to wait for them, and the split-KV attention in the style of Flash-Decoding, tuned for the new GPU.
Even after all of this though, the numbers barely moved, which forced the obvious question: "Why aren't custom kernels making this faster?" The honest answer was that I'd built kernels before profiling (a bad habit of mine, as seen above too). Some of them barely beat PyTorch or lost to it outright. My QKV projection took 9.20 µs against PyTorch's 8.64 µs, and gate/up only went from 49.8 to 46.0 µs. I was optimizing things I hadn't confirmed mattered.
So I profiled, the way I should have from the start. Grouped by what each kernel does, the model spent:
| Kernel group | GPU time in the trace |
|---|---|
| gate/up projection | 18.2 ms |
| output/down projection | 13.2 ms |
| QKV projection | 3.1 ms |
| vocab head (final projection) | 2.2 ms |
| attention | 1.5 ms |
Every row except attention is a matmul against model weights, and together they're about 96% of the time in these groups. That's what the roofline predicted. Each decode step has to stream every weight matrix from memory, gigabytes per token, while attention at short context only reads a few megabytes of cached keys and values. So the bottleneck was the matmuls, and attention barely mattered yet.
A first, cheap pass at the projection kernels (a transposed weight layout) gained 1.5–1.9% end to end, with SSD at 525 tokens/sec and AR at 313. Real, but small. Doing the matmuls properly meant a bigger rewrite, and that came later together with lower precision. Before starting it, I cleared out the other ideas already on my list, starting with fusion.
Fusion that lost
I'd already written a kernel that fused RoPE, the cache append and attention into one. It was correct, and it was slower in 14 of 16 cases, by 24–48%.
Fusion usually wins in two ways:
-
fewer kernel launches
-
fewer round trips to HBM, because intermediate results stay on chip instead of being written out and read back.
Neither helped much here. CUDA graphs had already made launches cheap. And the intermediates were tiny, for our workload. At decode, the rotated Q and K for 1 token are about 8 KB per layer, roughly 225 KB per token across all 28 layers, next to gigabytes of weights. Meanwhile the fused kernel dragged the RoPE math, extra temporaries and layout shuffles into the attention tile, and its shared memory use went way up, which lowered occupancy (fewer thread blocks fit on each SM at once, so less work ran in parallel). I was paying a real cost to save almost nothing.
What worked was the opposite move: removing work instead of combining it. My split-KV attention always runs as two kernels. At decode there's only one new query token per head, so giving each head a single thread block would leave most of the GPU idle. Instead, the first kernel splits the cache into 256-token chunks and lets many blocks each compute a partial attention result for one chunk at the same time. The second, a merge kernel, combines those partials into the final answer. But when the whole cache fits in one chunk, there's only one partial, and the merge does nothing useful. So I added a fast path: in that case, the first kernel writes the final output directly and the merge kernel is skipped. That cut attention time by 16–24% in those cases.
One catch I'll come back to: my kernel picked the number of chunks from how big the cache was allocated, not from how many tokens were actually in it. A cache allocated for 2,048 tokens always ran 8 chunks (2,048 ÷ 256), even when it held 50 tokens and 7 of those chunks were empty. So this fast path only kicked in when the buffer itself was small.
Along the way, most of the other "obvious" ideas died the same way:
| Idea | What happened |
|---|---|
| 2 warps of 32 threads instead of 4 | Lost all 8 comparisons |
| Manual load lookahead | 13–29% slower, more register pressure |
| C++ graph submission | Halved host time, 0.14% faster end to end |
| Tile-major weights (stored tile by tile, so each block reads one contiguous chunk) | ~2.5% faster projections, 0.4% faster requests, +5 GB memory |
| Adaptive draft depth | More cache hits, 6.6% slower: 54% more KV copying |
Each of these died because it sped up something that wasn't the bottleneck, or paid for its gain somewhere I wasn't looking.
A numerical problem that never closed
One correctness problem stayed open on this BF16 kernel path. Prefill, processing the whole prompt in one pass, matched Hugging Face exactly. Cached decode, generating one token at a time while reading earlier tokens from the KV cache, drifted on long prompts.
To measure the drift, I compared the probability my model gave every possible next token with the probability Hugging Face gave it, using total variation distance (TV): add up the absolute differences over all ~152k tokens and halve the sum. 0 means the two distributions are identical; 1 means they don't overlap at all. TV equals the most probability the two models could disagree on for any set of tokens, so TV = 0.25 means up to a quarter of the probability moved. I used it because decoding depends on probabilities, not raw logits, and TV is bounded and easy to read.
On a 2,048-token prompt, TV was 1.1% for the first generated token, then jumped to 24.5% on the next step, and the top token changed. That's exactly when the cache grew past 2,048 entries. My attention splits the cache into 256-token chunks, so 2,048 tokens fill exactly 8 chunks, and the next token opens a ninth. That boundary, either the code handling a nearly empty new chunk or the merge across nine partials, was the prime suspect. I never confirmed it. Pinning it down needed more GPU time on this BF16 path, and once I moved to the FP8 recipe with a different set of kernels, fixing the old path stopped being the best use of that time. It's still open.
Pushing for 1,000 tokens/sec
Up to here I'd been fixing whatever bottleneck showed up next. This is where I started pushing seriously on the goal from the start: 1,000 tokens/sec from a single request on two GPUs, with any parallelism scheme allowed. Single request, not the total across a batch. Batching makes throughput easy and answers a different question. (I briefly asked for batch sweeps up to 512 and long-context sweeps, then cut them back to batch ≤ 32 so the time went to the single-request number.)
A clean AR run on B300 gave the baseline: about 3.1 ms per token, with decode taking 92–96% of each request. Making prompt processing faster could never close the gap on its own.
The best SSD run so far (provisional, since this BF16 path still failed the Hugging Face check) did 611 decode tokens/sec, which works out to 2.74 tokens per 4.49 ms round. That's 1.64× short of the target, and the equation from the top says there are only two ways to close it: more tokens per round, or cheaper rounds. That gave me four bets:
- A cheaper drafter that guesses better. An EAGLE-3 drafter is a tiny network that reads the 7B's own hidden states instead of running a separate 0.5B model. That makes each draft step cheaper and gets more drafted tokens accepted per round.
- Faster MLP matmuls. The profile said gate/up and down were the biggest costs of the 7B's verification pass.
- Lower precision. When each step is bound by reading weights, halving bytes per weight comes close to halving the time of the 7B's pass.
- More SSD branches at once. SSD guesses how the 7B's check will end (say, "accepts 2 of the 4 drafted tokens") and pre-drafts the next round for that guess. My version prepared one guess per round. Drafting 4–8 guesses together in one batched draft pass would cover more outcomes for roughly the same draft time.
Tensor parallelism across the 2 GPUs was the other option. The tiny-model checks did pass, but with 56 cross-GPU gathers per decode step the upside looked thin, so I dropped the idea.
Precision needed a decision from me, since it changes the model. My rule stayed consistent: changing precision is fine as long as AR, SD and SSD still produce identical greedy output within the new recipe. That opened up the biggest lever on the list, FP8. Storing weights in 8 bits instead of 16 halves the bytes every step has to read.
The FP8 kernel that was secretly FP16
GPU time was expensive and hard to get, so I did as much as I could without one. Triton can compile kernels for the B300's architecture on any machine, and the compiled output shows exactly which instructions the GPU will run. (Side note: ngl, for a while the slowest part of the system wasn't a kernel. It was getting a GPU.)
That's how I caught this one. My first FP8 projection kernel compiled without errors. But the compiled code did the matrix multiply with FP16 instructions: it converted the FP8 weights to FP16 right before the math. So the "FP8 kernel" wasn't using the B300's FP8 tensor cores at all, and paid for the conversion on every load.
The cause was the shape, and it traces back to the graphs section. To keep shapes fixed, every verification was padded to 8 rows. On the H100 that was fine. On the B300 it wasn't: the query was padded to width 8, and in Triton 3.7 on SM100/SM103 that tile is too small for the new tcgen05 FP8 instructions, so the compiler quietly fell back to FP16. Padding the FP8 path to 16 rows instead got the real FP8 instruction. Since then, I check the instruction family in the compiled output and reject anything that falls back.
Compiling offline became a habit. I checked 384 shape variants this way, catching wrong instructions, register spills and resource limits before paying for any GPU time. It's useless for ranking speed, though. The schedules that looked best on paper lost a lot of real timing runs.
A trained drafter and two matmul schedules
Once I had GPUs again, the first run set a new baseline in the new recipe: the 7B's projection weights in FP8, attention and the KV cache still in BF16, and a published EAGLE-3 checkpoint in place of the 0.5B drafter. On a code prompt, AR ran at 293 tokens/sec and EAGLE SD at 564, 1.92× from speculation. Both numbers include the FP8 speedup; the gap between them is the drafter.
Making a published drafter fit
The EAGLE-3 checkpoint wasn't plug-and-play. Its description and its actual files disagreed in a few places, and every mismatch failed silently. I ended up trusting the tensors over the documentation:
- The checkpoint has 7 KV heads, not the 4 the model card describes.
- The draft vocabulary map stores offsets, not token IDs: target token = draft index + stored value.
- The drafter's inputs are the 7B's raw hidden states after layers 1, 13 and 24. Read them one layer off, or after normalization, and the drafter gets the wrong inputs without any error.
I ran this as plain SD, where drafting and checking take turns, not as SSD. EAGLE makes SSD harder: its drafter needs the 7B's hidden states from the latest check, and in SSD the drafter is supposed to start the next draft before that check has finished, so those hidden states don't exist yet. Getting around that means predicting them too, or keeping a few versions and repairing afterward. I haven't built that yet.
Two matmul schedules that survived
Next was the 7B's own pass, the biggest cost in every round. A matmul kernel splits the output into tiles and gives each tile to a block of GPU threads. A schedule is the set of knobs for how it does that:
- BN: how many output columns each block computes.
- BK: how many numbers along the shared dimension it loads per step.
- Stages: how many loads it keeps in flight, so the next tile arrives while the current one is being multiplied.
- Split-K: cut the long dimension into pieces handled by separate blocks, then add their partial sums at the end. That gives the GPU more parallel work when there's only one row to compute, as in decode.
I searched these for gate/up and down, the two biggest projections, with the exact-output rule in force. The first round found six candidates that were all correct and all slower. The second found two winners: 1.33× faster on gate/up (BN=128, BK=256, 3 stages) and 1.60× faster on down (BN=64, BK=128, 3 stages, split-K=4).
Three other candidates for down were even faster, but they failed the exact-output check, for the same reason the decoders disagreed at the very start. Each output of the down projection is a dot product over 18,944 numbers. With split-K=4, four blocks each handle a quarter of that (4,736 numbers), adding BK of them per step into a running sum. At BK=128 that's 37 steps per block, at BK=256 it's 19. Every step rounds the running sum, so a different step size rounds at different points, and the final value comes out different in the last few bits. That was enough to flip some tokens. Same math, different rounding, so I rejected them.
Then I tested the two winners in the full model, alternating requests between old and new schedules on the same two B300s, five repeats each. Nothing else changed, so these gains are the schedules alone:
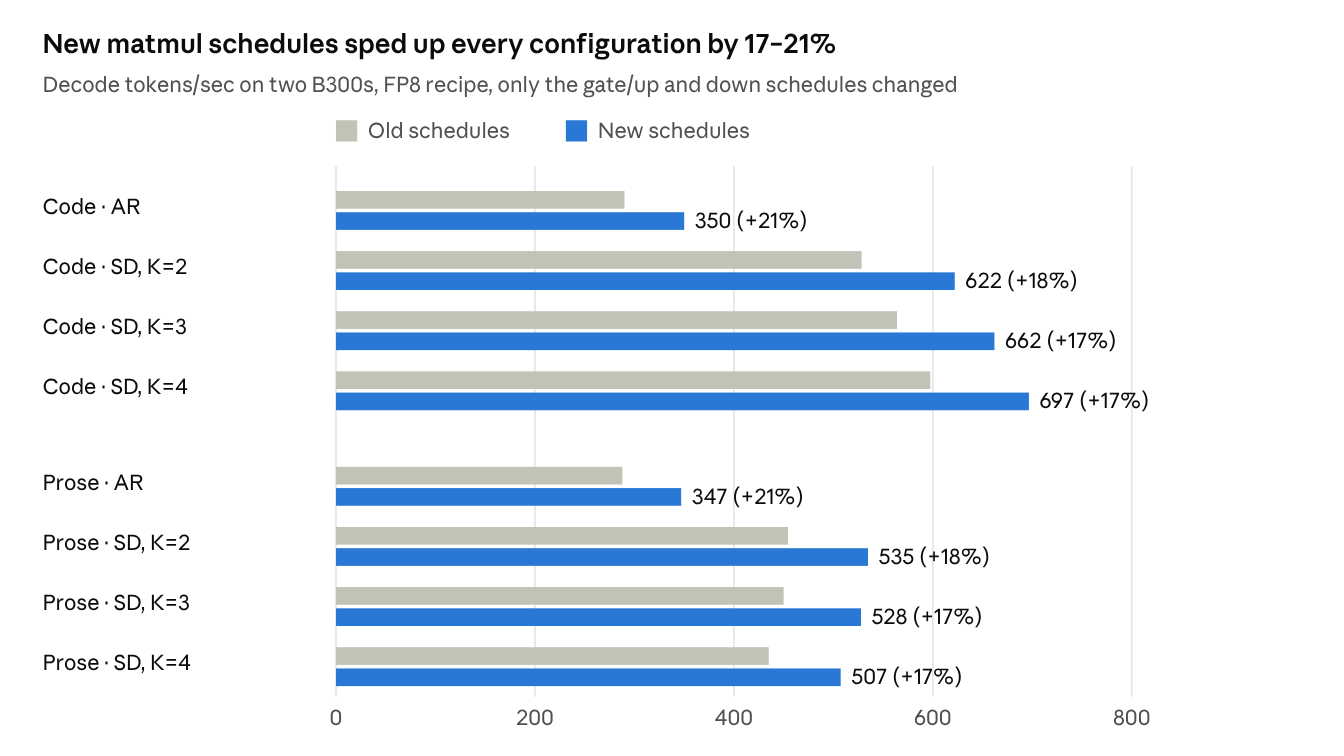
AR got about 21% faster and SD about 17%. Every configuration produced identical output with old and new schedules, and every confidence interval excluded a slowdown. It was the first kernel change of the project that was faster as a kernel and faster as a full request. The best result, 697 decode tokens/sec (643 counting prefill), stacks several things: the FP8 recipe, the EAGLE drafter, drafting K=4 tokens per round, and these schedules.
Why K=4 won on code and K=2 on prose
The benchmark had two separate workloads: a short code prompt (128 tokens in) and a longer prose prompt (512 tokens in). Different text, different length, different difficulty for the drafter, so their numbers shouldn't be compared with each other, only across K within each one.
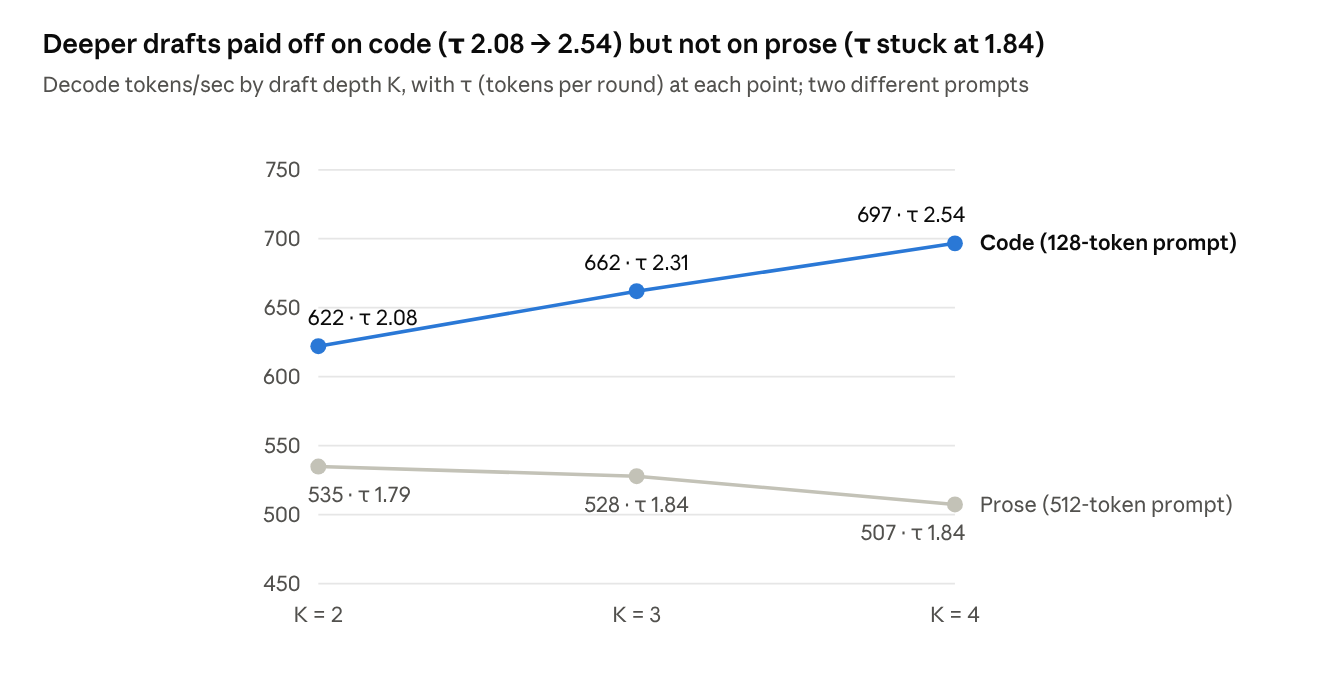
On code, the drafter's guesses were good, going from K=2 to K=4 raised τ from 2.08 to 2.54, and the extra accepted tokens were worth the extra draft steps. On prose, K=3 and K=4 both got 1.84 tokens per round, so K=4's extra draft step bought nothing and still cost time. Same equation as always: τ over round time.
One request, 128,000 tokens
The earlier 697 tokens/sec number came from 128-token outputs, which hide the cost of a growing cache. So I wanted to see the opposite extreme: let the KV cache fill and generate 128,000 tokens in one request, full history kept. No sliding window, no eviction, no restarting with a fresh prefill.
Qwen2.5-7B was trained on sequences up to 32,768 tokens, so first it needed a longer context. The model encodes position with RoPE: it splits each 128-dimensional query and key into 64 pairs and rotates each pair by an angle equal to the token's position times that pair's frequency. The frequencies range from fast to very slow. Fast pairs tell neighbouring tokens apart, slow pairs encode long distances. Because attention takes a dot product of a rotated query and a rotated key, it only sees their relative distance. Past 32,768 tokens, the slow pairs reach angles the model never saw in training. YaRN divides the frequency of those slow pairs by 4, leaves the fast pairs unchanged, and adds a small attention-temperature correction, so all 131,072 positions map into the range the model was trained on. (Picture clock hands: YaRN slows only the hour hand, so a longer day still fits on the same face.)
I used AR on one GPU to isolate the target model, with 131,072 cache slots:
2 (K,V) × 28 layers × 4 KV heads × 128 dims × 2 bytes = 57,344 bytes per token
× 131,072 slots = 7.5 GB of KV cache
The first attempt hit its own time limit at 119,968 tokens. I threw it away rather than resume it with a second prefill, which would have defeated the point. The second run finished: 128,000 tokens in 632 seconds, 202.5 tokens/sec on average. Peak memory held by PyTorch tensors (weights, cache and activations, as reported by torch.cuda.max_memory_allocated) was 27.5 GiB. Every token it shared with the first attempt matched exactly.
To be clear, the model did emit EOS at token 1,391. This tests whether the system survives 128k tokens of history, not whether the model writes anything useful that far out.
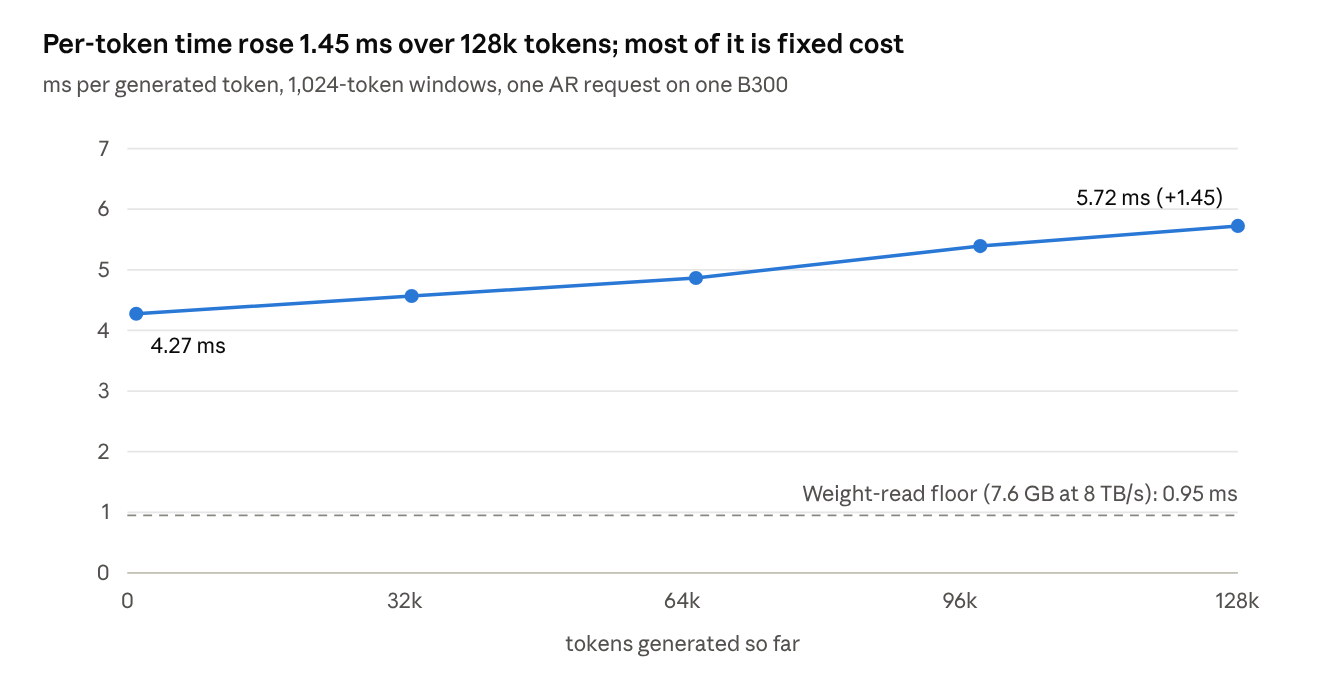
The run was measured in windows of 1,024 generated tokens: tokens 1 to 1,024, then 1,025 to 2,048, and so on, about 125 windows in all, and each point on the chart is one window's average. Time per token rose from 4.27 ms in the first window to 5.72 ms in the last, 34% more time per token, or 25% lower throughput. At the end, each step reads about 7.3 GB of KV on top of 7.6 GB of weights, so a purely bandwidth-bound decoder should have nearly doubled. The extra 1.45 ms for 7.3 GB of extra reads works out to about 5 TB/s. Reading the cache costs roughly what bandwidth predicts.
The surprise was the first window. With the cache almost empty, a step already took 4.27 ms, while AR in the short-context setup took 2.86 ms. The two setups weren't identical (different cache size and position encoding), so it isn't a controlled comparison. But a 1.4 ms gap with nothing in the cache suggested the 131k-slot setup must be paying a fixed cost on every step, full or not.
It was. Remember the catch from the fusion section i.e split-KV attention sizes its chunks by allocated slots. 131,072 slots meant 512 chunks and a 512-way merge on every step, even at token 1. The merge kernel reduced a 512 × 128 tile per attention head inside a single thread block, which is far more data than fits in that block's registers. The compiler reported 766 register spills, values it had to park in slow local memory and fetch back. Spill counts come straight out of compilation, so I saw this without running anything on a GPU.
Splitting each head's 128 dimensions into four tiles of 32, each handled by its own block, removed every spill and made full attention 6.4× faster at short occupancy (52.9 → 8.3 µs).
Then it failed the exact output check. I compared the attention outputs, the vectors attention hands to the rest of the layer, between the old and new kernels. At longer contexts they differed by up to 3×10⁻⁵ in BF16, because the new tiling combined the partial results in a different order. Tiny, but those values feed every later layer, and this project started with a difference in the last bits flipping a token at 29.875.
Shipping the 6.4× as its own backend
I had two options:
-
Force the new kernel to add things in exactly the old order - that would have meant undoing much of what made it fast, and I hadn't even pinned down which instruction first diverged.
-
accept that the new kernel is a different numerical recipe - that means that neither order is more correct and both are valid roundings of the same math
What my rule actually needs is that AR, SD and SSD all run on the same kernel and agree with each other. So I made the new merge its own versioned backend and re-ran the agreement suite against it from scratch. For this backend it was 117 checks, including complete AR and SD outputs at K=2 and K=4 matching token for token on both a 128-token and a 2,048-token context, plus the rollback, stopping and request-reuse checks. All 117 passed. The new backend's text isn't identical to the old backend's (the first difference shows up around token 1,018 of the long run), but inside the new backend every decoder agrees, which is what the rule asks for.
What changed in the kernel:
Before: 1 block per head  → reduce [512 splits × 128 dims]   28 blocks per query
After:  4 blocks per head → reduce [512 splits ×  32 dims]  112 blocks per query
The smaller working set fits in registers: spills went from 766 to 0, and registers per thread went from 32 to 159. More registers per thread sounds worse, but it's the point. The data now stays in registers instead of spilling to slow memory. The change also gives the GPU 4× more blocks to spread across its SMs.
| Attention, 131k-slot cache | Old | New |
|---|---|---|
| 128 tokens occupied | 53.2 µs | 8.2 µs (6.5×) |
| ~128k tokens occupied | 109.8 µs | 50.7 µs (2.2×) |
The speedup shrinks at long context because by then most of the time goes to actually reading the KV history, which the merge fix doesn't touch.
It also explains the surprise from the 128k run. Saving 45 µs of attention in each of 28 layers is about 1.26 ms per token. Take that off the 4.27 ms first-window step and you get about 3.0 ms, close to the 2.86 ms of the short-context runs. Most of that fixed cost was this one kernel.
In the full model, at the same ~83k-token checkpoint, AR went from 195.8 to 272.7 tokens/sec (+39%). The merge backend was the only change between those runs; I also tried other tile and warp settings and a separate normalization kernel in that round, but none of them made it in. The two runs did use separate GPU allocations, so a little of the difference could be machine-to-machine noise. It's +39% and not 2–6× because attention merge is only one part of a decode step; the projections, the vocab head and everything else still run.
Where this leaves the 1,000 tokens/sec goal
Put the best run into the equation from the top. At K=4 on code, τ = 2.54 and throughput is 697 tokens/sec, so one round takes:
The logs agree: 3.67 ms per verification round at K=4, counting drafting and everything else. But an AR step, which is one 7B pass, costs 2.86 ms, and verifying 5 positions should cost slightly more, so a reasonable estimate is about 2.9 ms for the 7B's pass and about 0.75 ms for drafting, repair and coordination.
Now ask what SSD could do. At best it hides all of the drafting, so the round shrinks to about the 7B's pass alone:
Even perfect SSD overlap doesn't reach 1,000. That's the main thing this project taught me about where the time goes: the drafter isn't the bottleneck anymore, the target forward pass is, and it's running at about a third of what the hardware allows (2.86 ms against a 0.95 ms floor). The remaining 30% has to come out of that pass.
What I might do next some time in the future, in order:
- Profile the current FP8 + EAGLE pipeline end to end
- Close the gap between 2.86 ms and the 0.95 ms floor
- Raise τ on hard text. Prose stalls at 1.84 tokens per round. A better-matched drafter matters more there than deeper drafts.
- Build trained-EAGLE SSD (only if the profile shows drafting is a big enough slice to be worth hiding)
- Test, test, and test.